Chapter 5 Notes
Chapter 5: Motion in One-Dimension
Average and Instantaneous Speed (or velocity)
1) speed = distance/ time or s = d/t ; measured in m/s
2) average speed (or velocity, v) :  , where d is the total distance and t is the total time elapsed. *Note, place a bar above the v when calculating average velocity.
Work practice problems 1-3, page 85..
3) Instantaneous speed is the speed at any instant, this quantity is what a speedometer measures. On a position vs time graph, find the slope of the line at any particular point in time to get instantaneous velocity. This may require constructing a line tangent to a point on a curve, and then determining the slope of the tangent. Do you know another analytical method of finding the slope of a curve at a particular point using the calculus?
Velocity and Speed
1) velocity = displacement/time, plus the direction. , (north, south ... etc.)
2) Displacement is the distance between the final position and the initial position or
![]() plus a direction. Remember that distance is a scalar quantity and displacement is a vector quantity.
plus a direction. Remember that distance is a scalar quantity and displacement is a vector quantity.
Example: You walk from A to B, then you turn around and walk back to A.
![]()
The distance you traveled was 2AB; but your displacement was zero.
3) 
The above formula only provides average velocity. You only deal with two known data points. Graphing this data would, of course, produce a straight line on a position vs. time graph. This would indicate a constant velocity, but the graph would not be correct. Using only two data pieces, the initial and final values, doesn't really tell us anything about what happened with regard to the motion of the object between these two points. Average velocity has very little meaning in a situation such as moving an object at rest to a new position, a short distance away in a short amount of time.
Position Vs. Time Graphs.
The slope of the line on a position vs. time graph indicates the velocity of an object. (note: "rise" over "run" is the same as the change in position divided by the change in time). Remember that velocity is calculated as change in position divided by change in time. This is the same calculation for slope on p vs t graphs!
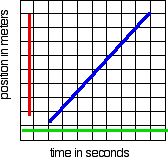
A straight line (constant slope, the blue line on the graph below) on a position vs time graph indicates CONSTANT velocity (steady velocity).
A straight line parallel to the time axis (the green one below) on such a graph indicates that the velocity is constant at zero.
A straight line parallel to the position axis (red) on such a graph indicates no change in time with a large change in position. This is most likely not possible under normal circumstances!
A curved line on a position vs. time graph (ie.. non constant slope like on the graph below) means that the velocity is NOT constant. Non-constant velocity is, by definition, acceleration.
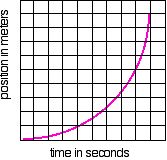
Position can ge graphed and motion of an object can be analyzed this way. Would it be correct to say that there actually is an 'instantaneous velocity' that could be determined for any given point in time on the above graph? YES! The curve above can be describes as 'a collection , or set, of all the instantaneous velocities between time = 0 and 9'. This is another way of describing acceleration.
Here's an online tutorial of position vs. time graphs.
Relativity of Velocity
Velocity depends on your frame of reference. For example, throwing a
baseball (10 m/s) from the back of an airplane to the front of the plane
(500 m/s).
On velocity-time graphs,
- any straight line indicates constant acceleration
- the slope of the line indicates the acceleration rate
- a straight line parallel to the time axis indicates no change of velocity
- velocity is constant
- acceleration is constant at zero
- a straight line parallel to the velocity axis would indicate change of velocity without change in time, and is also not possible under normal circumstances
- a curved line indicates that the acceleration rate is changing with time.
- the rate of acceleration at any point in time (instantaneous acceleration) may be found by finding the slope of a line tangent to that point
Here's an online tutorial about speed and velocity.
Lab Activity: #1 Chapter 5 lab, page 100. #2. Ball drop with motion sensor
Homework:
Set #1: Review questions 1,2,27,28,31,33,34
set#2: : Review questions3-5, 39-41
Set#3: Review questions 50-58
Set#4: Review questions 66-71